
Want to Open a Dispensary? You'll Make the Most In These States
Want to Open a Dispensary? You'll Make the Most In These States

Insights |
Eric Allred - Head of Product

Looking to understand the revenue potential in the legal cannabis industry? We've analyzed dispensary performance across every major market in the United States, revealing dramatic differences in earning potential between states. From California's massive $5.3 billion market to Rhode Island's impressive $16.8 million per-store average, here's your complete guide to cannabis retail revenue.
Top 10 States by Total Cannabis Revenue
1. California
Total Revenue: $5.3 billion (2023)
Tax Revenue: Over $567 million
Market Dynamics: California operates under a three-tier licensing system with over 1,200 licensed retailers competing in a fragmented market. Geographic disparities in market access persist due to municipal opt-out provisions, while wholesale prices have compressed from $1,200/lb in 2021 to approximately $650/lb in 2023. The market faces ongoing pressure from illicit operations while maintaining sophisticated consumer demand for premium products.
Performance Drivers: Success hinges on sophisticated inventory management and data-driven decision-making. Successful operators focus on premium segment optimization and private label development. Strategic location selection and customer experience investment have become crucial differentiators in this competitive landscape.
2. Michigan
Total Revenue: $2.9 billion (2023)
Tax Revenue: Approximately $270 million
Market Dynamics: Since implementing adult-use sales in 2019, Michigan has grown robustly through strong medical-to-recreational conversion and municipal opt-in expansion. The market emphasizes vertical integration and premium product development, with increasing consolidation through M&A activity and emerging tourism-driven markets in certain regions.
Performance Drivers: Operational efficiency and strategic location selection in underserved markets drive success. Top performers excel through advanced inventory management systems, robust loyalty programs, and optimized supply chain operations while maintaining strong community engagement.
3. Illinois
Total Revenue: $1.6 billion (2023)
Tax Revenue: Approximately $450 million
Market Dynamics: Illinois maintains a tightly controlled market through limited licensing, sustaining premium pricing, and high barriers to entry. A high concentration in the Chicago metro area combines with growing suburban expansion and emphasis on social equity licensing while maintaining strong medical patient retention alongside adult-use growth.
Performance Drivers: Success depends on premium pricing strategies and operational efficiency within strict regulations. Strategic location selection and sophisticated inventory management differentiate top performers, emphasizing customer education and experience enhancement.
4. Massachusetts
Total Revenue: $1.56 billion (2023)
Tax Revenue: Approximately $169 million (2023)
Market Dynamics: Massachusetts maintains its position as the Northeast's leading cannabis market through substantial regulatory compliance and strategic expansion. The market supports premium pricing while developing suburban opportunities and emphasizing vertical integration for operational control.
Performance Drivers: Success relies on operational efficiency and strategic location selection. Leading operators differentiate through customer experience enhancement and sophisticated inventory management while maintaining strong community relationships.
5. Colorado
Total Revenue: $1.36 billion (2023)
Tax Revenue: Approximately $263 million (2023)
Market Dynamics: As a mature market, Colorado demonstrates stable consumer demand alongside increasing competition. The state balances strong local brand development with tourism influence while emphasizing product innovation and retail experience evolution in response to sophisticated consumer preferences.
Performance Drivers: Market leaders focus on operational efficiency and cost control while maintaining a quality customer experience. Success requires sophisticated inventory management and strong loyalty program development, complemented by strategic vendor relationships.
6. Washington
Total Revenue: $1.2 billion (2023)
Tax Revenue: Approximately $460 million (2023)
Market Dynamics: Washington's established market operates under a stable regulatory framework with a 37% excise tax rate. Limited vertical integration affects supply chain strategies, while the sophisticated consumer base demands quality products and services, driving innovation in product development and retail experiences.
Performance Drivers: Success stems from operational efficiency and strategic vendor relationships. Top performers excel through technology integration and customer experience enhancement, emphasizing data-driven decision-making.
7. Missouri
Total Revenue: $1.1 billion (2023)
Tax Revenue: Approximately $67 million (2023)
Market Dynamics: Missouri's market has demonstrated exceptional growth since launching adult-use sales in February 2023, quickly establishing itself as a significant Midwest cannabis market. The state's regulatory framework strikes a balance between market access and control, with strong initial demand driven by both in-state consumers and border-state tourism. The market benefits from strategic positioning between several prohibition states while maintaining competitive pricing and product diversity.
Performance Drivers: Success in Missouri's market stems from efficient operations management and strategic location selection near population centers and state borders. Leading operators excel through sophisticated inventory management systems that respond to rapid demand shifts while developing strong loyalty programs to maintain customer retention in an increasingly competitive landscape. Market leaders emphasize customer education and experience to differentiate their offerings.
8. Arizona
Total Revenue: 991 million (2023)
Tax Revenue: Approximately $173 million (2023)
Market Dynamics: Arizona's swift recreational implementation has created a robust market combining medical and adult-use sales. The limited license framework maintains strong margins, while vertical integration opportunities drive operational strategy. Tourism influences key market areas, particularly in destination regions.
Performance Drivers: Successful operators focus on operational excellence and strategic market positioning. Customer experience and product mix optimization drive performance, supported by sophisticated technology integration and marketing efficiency.
9. Oregon
Total Revenue: 955 million (2023)
Tax Revenue: Approximately $169 million (2023)
Market Dynamics: Oregon's mature market faces ongoing price compression and intense competition, driving focus on operational efficiency and product innovation. The sophisticated consumer base demands quality and variety, while market consolidation creates opportunities for strategic operators.
Performance Drivers: Leaders distinguish themselves through operational excellence and cost management. Success requires strategic product mix optimization, strong customer loyalty programs, and efficient supply chain management.
10. Nevada
Total Revenue: 825 million (2023)
Tax Revenue: Approximately $121 million (2023)
Market Dynamics: Nevada's unique tourism-driven market, particularly in Las Vegas, creates distinct operational opportunities and challenges. The limited license framework maintains market stability while operators balance local and tourist consumer needs through sophisticated retail experiences.
Performance Drivers: Success depends on capitalizing on tourism opportunities while maintaining strong local customer bases. Operational efficiency and strategic location selection remain crucial, supported by sophisticated marketing and customer service programs.
Top 10 States by Average Annual Revenue per Dispensary
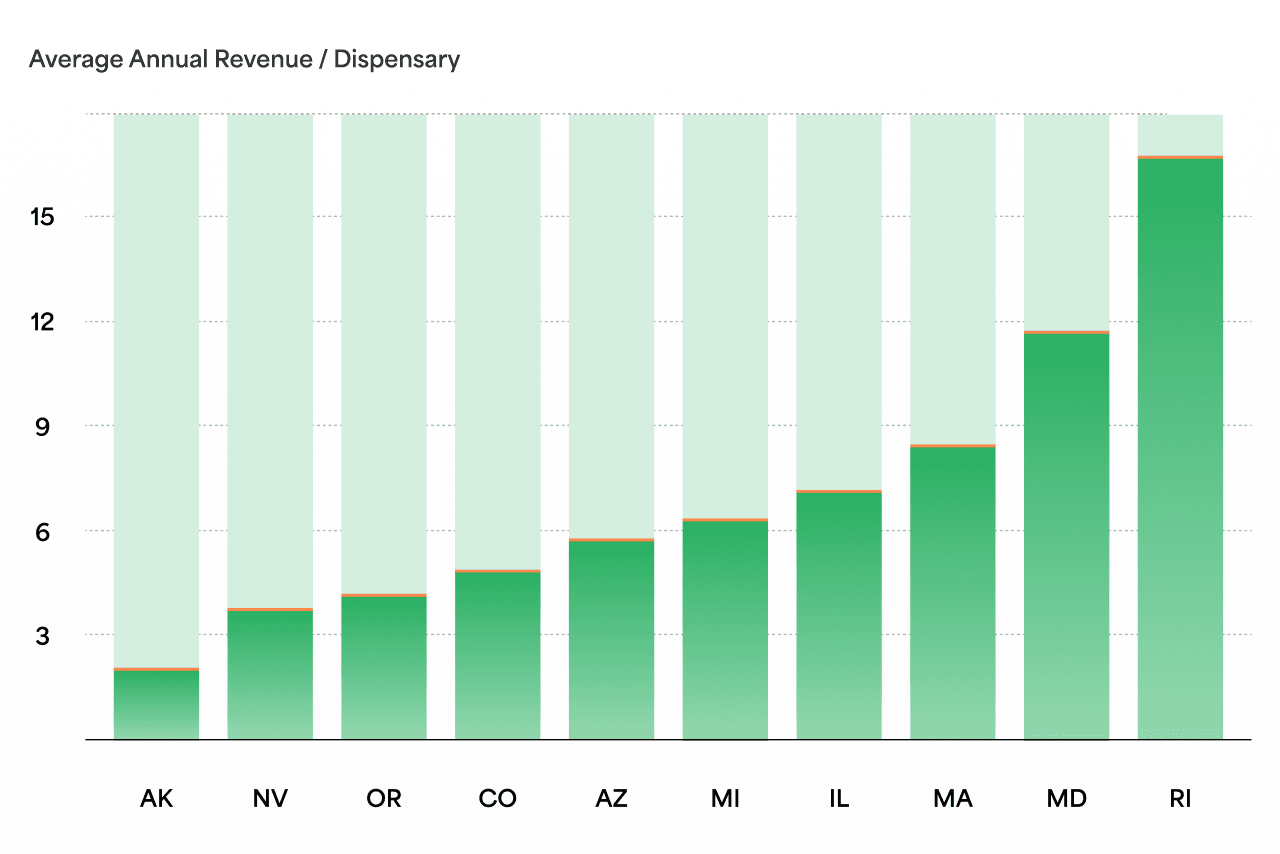
The list below shows 2024 projections for average cannabis sales per dispensary based on the top 10 state markets:
1. Rhode Island
Average Revenue per Dispensary: $16.8 million
Number of Retailers: Seven (combined adult-use and medical)
Market Dynamics: Rhode Island's limited licensing creates the highest per-store revenue nationally. The market builds on a strong medical foundation while developing adult-use sales, with premium pricing sustainability through restricted competition and strategic regional positioning.
Performance Drivers: Success relies on operational excellence and strategic market positioning. Leading operators focus on customer experience enhancement and sophisticated inventory management while maintaining strong community relationships.
2. Maryland
Average Revenue per Dispensary: $11.8 million
Total Market Size: $1.13 billion across 96 stores
Market Dynamics: Maryland's successful transition to adult-use sales in July 2023 builds on a strong medical market foundation. The limited license framework maintains premium pricing opportunities while emphasizing compliance and quality control in this emerging adult-use market.
Performance Drivers: Top performers excel through operational efficiency and strategic positioning in this evolving market. Success requires sophisticated inventory management and strong customer service programs supported by effective marketing and community engagement.
3. Massachusetts
Average Revenue per Dispensary: $8.5 million
Market Dynamics: Massachusetts combines strong regulatory oversight with steady market growth, maintaining its position as a Northeast leader. The well-regulated market supports premium pricing while emphasizing quality control and customer service excellence.
Performance Drivers: Success stems from operational excellence and strategic location selection. Leading operators maintain sophisticated inventory management and strong customer loyalty programs while emphasizing community engagement.
4. Illinois
Average Revenue per Dispensary: $7.2 million
Market Dynamics: Illinois's limited licensing model creates high-demand market conditions with strategic location advantages. The market supports premium pricing through restricted competition while strongly emphasizing compliance and quality control.
Performance Drivers: Top performers excel through premium pricing strategies and operational efficiency. Success requires sophisticated inventory management and strong customer service programs supported by effective marketing and community engagement.
5. Michigan
Average Revenue per Dispensary: $6.4 million
Market Dynamics: Michigan's well-established framework supports strong consumer acceptance and consistent market expansion. The mature regulatory structure provides stability while allowing for strategic growth and market development.
Performance Drivers: Success depends on operational efficiency and strategic market positioning. Leading operators maintain sophisticated inventory management and strong customer loyalty programs, emphasizing local market optimization.
6. Arizona
Average Revenue per Dispensary: $5.8 million
Market Dynamics: Arizona's swift recreational implementation creates favorable growth conditions while maintaining market stability through limited licensing. The market supports strong margins while emphasizing operational efficiency and customer service excellence.
Performance Drivers: Top performers focus on operational excellence and strategic positioning. Success requires sophisticated inventory management and strong customer service programs supported by effective marketing and community engagement.
7. Colorado
Average Revenue per Dispensary: $4.9 million
Market Dynamics: Colorado's pioneer status provides mature market stability while requiring optimization in a competitive landscape. The sophisticated consumer base demands quality and variety, driving innovation in products and services.
Performance Drivers: Success in this competitive market relies on operational efficiency and cost management. Leading operators maintain sophisticated inventory management and strong customer loyalty programs, emphasizing local market optimization.
8. Oregon
Average Revenue per Dispensary: $4.2 million
Market Dynamics: Oregon's market experiences significant price fluctuations while maintaining a substantial economic contribution. Market saturation drives the focus on operational efficiency and customer service excellence.
Performance Drivers: Top performers excel through operational excellence and cost management. Success requires sophisticated inventory management and strong customer loyalty programs supported by effective marketing and community engagement.
9. Nevada
Average Revenue per Dispensary: $3.8 million
Market Dynamics: Nevada's tourism influence creates unique market opportunities while maintaining a strong local market presence. The market combines tourism-driven development with stable local customer bases.
Performance Drivers: Success depends on balancing tourist and local market needs through strategic positioning. Leading operators maintain sophisticated inventory management and strong customer service programs, emphasizing market-specific optimization.
10. Alaska
Average Revenue per Dispensary: $2.1 million
Market Dynamics: Alaska's unique geographic and demographic factors shape market development while maintaining a focus on local consumption. The market emphasizes efficiency and local market optimization while adapting to seasonal tourism influences.
Performance Drivers: Success stems from operational efficiency and strategic local market positioning. Top performers maintain sophisticated inventory management and strong community relationships while emphasizing customer service excellence.
Future Market Outlook

The cannabis industry continues to evolve, with several key trends shaping future revenue potential:
Emerging Opportunities
The market shows continued growth through new adult-use market launches, existing market optimization, and technology integration driving efficiency. Brand differentiation becomes increasingly crucial as markets mature and competition intensifies.
Market Consolidation
Strategic merger opportunities increase as markets mature, with multi-state operators expanding their footprint and brand acquisition activities accelerating. Local market expertise remains valuable, while operational efficiency drives success.
Conclusion
Understanding these market dynamics and revenue patterns is crucial for cannabis industry stakeholders. While California maintains the most extensive total market size at $5.3 billion, Rhode Island's limited licensing approach generates the highest per-dispensary revenue at $16.8 million annually.
Success in any market requires a careful balance of operational excellence, market understanding, and strategic positioning, emphasizing local market conditions and consumer needs.
About The Cannabis Marketing Agency
The Cannabis Marketing Agency: Cannabis marketing experts making your dispensary the one everyone talks about (in a good way).
We make your dispensary the local favorite — the spot people talk about, shop at, and keep coming back to.
+4 Years Growing Dispensaries: We don't "learn on your dime".
Trusted by Dispensaries in 18 Markets: From Cali to Mass, if it’s legal, we’ll help you win.
For DIYers who hate learning the hard way.
Want More Dispensary Customers?
We grow dispensaries like it’s our day job (because it is). Ever wonder what we’d do for yours? Let’s find out.
Get Started